In-sample performance

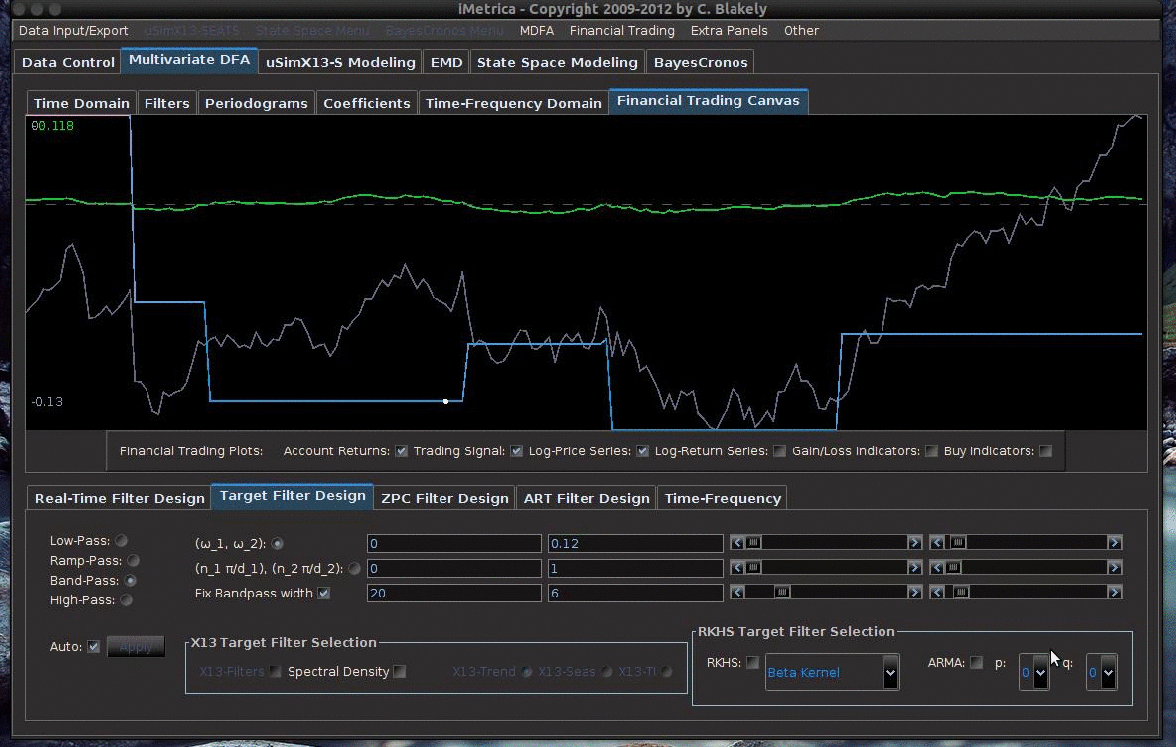
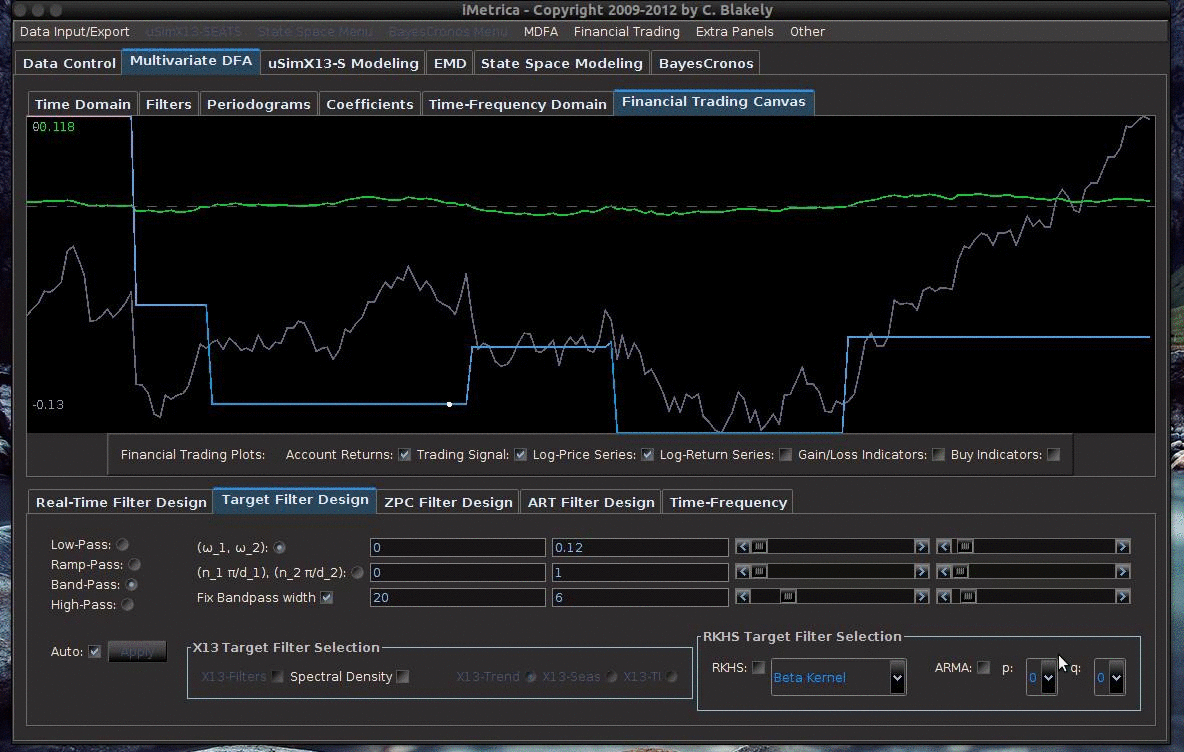
Animation 2: Click to view animation. The in-sample performance of the trading signal for each frequency sweep shown in the animation above.

Animation 2: The in-sample performance of the trading signals for each frequency sweep shown in the animation above. Notice how the majority of the winning trading signals are found in the regions of the spectral peaks between \pi/6 to \pi/6.

Advertisement

Leave a Reply

Fill in your details below or click an icon to log in:

WordPress.com Logo

You are commenting using your WordPress.com account. Log Out /  Change )

Twitter picture

You are commenting using your Twitter account. Log Out /  Change )

Facebook photo

You are commenting using your Facebook account. Log Out /  Change )

Connecting to %s