iMetricaFX: An interactive JavaFX app for the MDFA-Toolkit

Selection_072.png

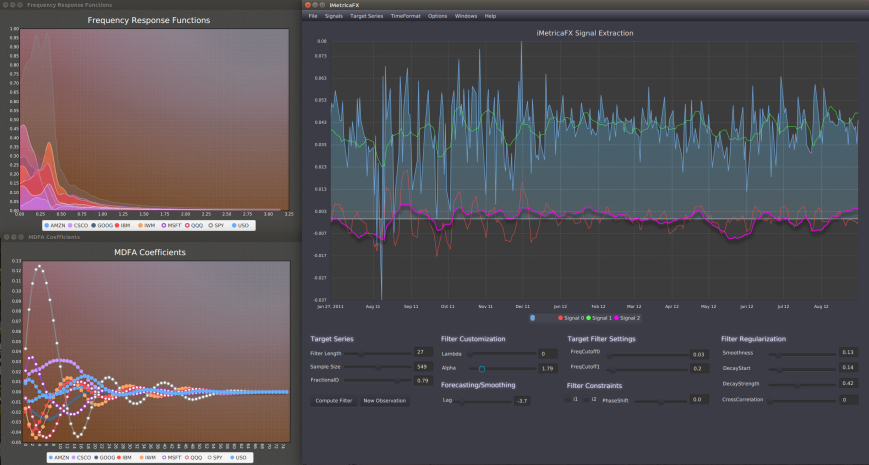
Figure 1: The main interactive iMetricaFX user interface.  

Introduction

We introduce an interactive app completely written in Java/FX for doing real-time signal extraction in multivariate time series.  iMetricaFX is a completely redesigned application from the previous iMetrica, focusing mostly on the multivariate direct filter approach and it’s derivatives for generating real-time signals and analyzing multivariate time series. It retains all the features of the MDFA module in iMetrica, but now with better responsive 2D graphics written in JavaFX, and focusing on real-time data analysis applications.

One might want to use iMetricaFX for any of the following reasons:

  • To learn visually how MDFA hyperparameters interact with each other, and how their changes affect filter coefficients, frequency domain, signal extraction results.
  • To understand how MDFA signal extraction parameters, transformations on time series, additional explanatory variables, or other features affect the behavior of out-of-sample signal quality on future data or some  performance metrics (MSE, Sharpe ratios, seasonal/cycle adjustments, etc).
  • To experiment with MDFA parameter definitions for use in the MDFA-DeepLearning package.
  • To engineer financial trading signals and track their performance out-of-sample given specific trading requirements
  • To analyze correlations between a collection of (non)stationary time series and how they affect signal extractions

Overview

We now given an overview of the different components and features of the iMetricaFX system. The first, most obvious step, in getting iMetricaFX rolling is to define the data source. The easiest data source is a collection of .csv files that have DateTime stamps for the index, with the data values in the following columns. Each column should have a header to describe that column, (e.g. “DateTime”, “Timestamp”, and “Bid” or “Open”).

In the resources folder, there is a collection of .csv files which contain daily “Close” values of a few dozen NASDAQ stocks and etfs with historical data dating back the past 6 years. All files contain the same date range period.

Add files is selected from the top menu bar, and in selecting multiple files holding the ‘ctrl’ button will upload all files for streaming data from each simultaneously for multivariate signal extraction. The DateTime format of the files can be selected in the top menu as well, in the TimeFormat menu.

Once the data files have been selected and loaded, to compute the initial default signal using the default MDFA hyperparameter settings, use the “Compute Filter” button at the very bottom left. Once the data has been loaded and the initial filter coefficients have been computed for the initial time series observations, one can then construct several types of signals, apply out-of-sample data, adjust time series transformation, change filter parameters, add additional explanatory series, and more. Here is a list of all the different current interface controls.

  • Menu:File Open .csv data files for time series observations, save filter parameters, load filter parameters.
  • Menu:Signals Create/select new signals. When a new signal is added, the filter hyperparameters will be applied to the currently selected signal. All other signal parameters will remain fixed.
  • Menu:Target Series In the multivariate case, select the target series among all the series loaded. The target series represents the series from which the signal will be built.
  • Menu:TimeFormat The DateTime stamp format of the time series. Usually for daily data this looks like “yyyy-MM-dd” or for minute data “yyyy-MM-dd HH:mm:ss”
  • Menu:Options A variety of options can be chosen here. For now, only Prefiltering on/off is available.
  • Menu:Windows Select the windows that plot the various signal extraction properties. Options are MDFA Coefficients, Frequency Response Functions, and Time/Phase delay. More window types will be added in the future.
  • Compute Filter Compute the filter given the latest Series size observations and current filter hyperparamter settings
  • New Observation This button adds a new (multivariate) time series observation from the referenced .csv files. If there are no more values left in the .csv file, then no new values will be given.
  • Filter length Change the length of the filter from 4 to 100
  • Series size Change the number of in-sample time series observations for computing MDFA coefficients
  • FractionalD The fractional difference exponent between 0 and 1 (first-order differencing)
  • Filter Customization Adjust the smoothness and timeliness parameters
  • Forecasting/Smoothing Adjust the forecasting (negative value) or smoothing lag (positive value)
  • Target Filter Adjust the frequency range for the signal using two frequency cutoffs
  • Filter Constraints Toggle the i1 and/or i2 constraint and the set the Phase Shift for the i2 constraint
  • Filter Regularization Adjust the smoothness, decay, decay strength, and cross regularization for the filter coefficients

Forecasting, Seasonal Adjustment, and Signal Extraction with uSimX13 in iMetrica

Selection_091.png

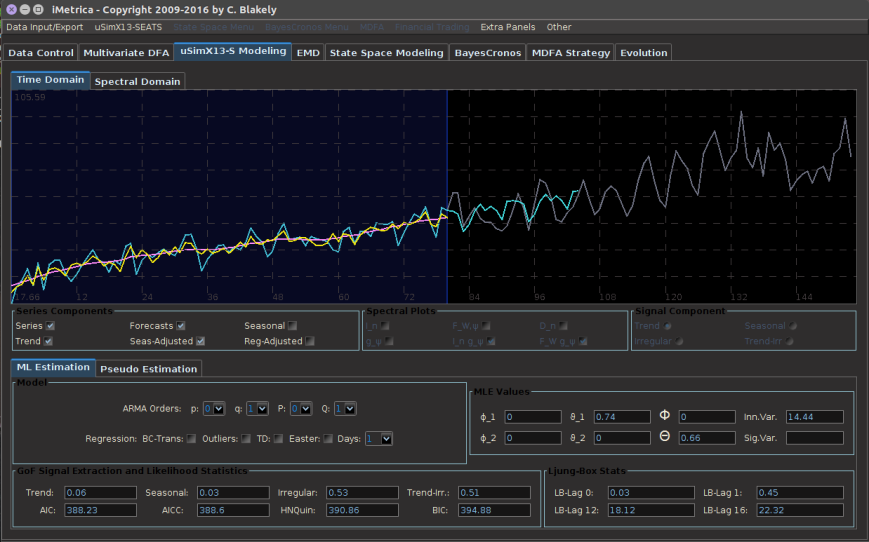
Figire 0. The uSimX13 module in iMetrica provides interactive and dynamic forecasting and signal extraction powered by X-13-ARIMA-SEATS. 


The uSimX13-SEATS (uSimX13) module featured in the iMetrica software suite is an interactive graphical user-interfaced time series modeling and simulation environment. The main attraction of uSimX13 is that it features computational modeling routines from the X- 13ARIMA-SEATS (X-13A-S) software developed and published by the Census Bureau of the US Department of Commerce. The uSimX13 environment offers a unique time series modeling software with the primary goal of analyzing economic time series data using the most commonly used features of X-13ARIMA-SEATS, while providing a large array of classical and modern goodness-of-fit tests to assess different model fits of the data, many different graphical representations of the time series data, adaptive time series decomposition capabilities, and much more all while being accessible to both beginners in the field of econometrics wanting to visualize frequently used tools, and practitioners wanting to obtain forecasts, seasonal/trend adjustments, and/or test and apply regression components to their data.

While there are other X-13A-S “engines” and interfaces in existence, including the original Fortran program and the excellent R package entitled seasonal , uSimX13 in comparison serves to provide most of the commonly used and important features of X-13-ARIMA-SEATS without the use of any programming interface – one simply loads the data into the module (I will show how in this article), and then all the aspects of the modeling, including forecasting, seasonal adjustment, auto-model, and model selection, can be done with just using the iMetrica user-interface. In addition, several interactive features are available to aid in model selection in determining the best model fit for one’s data, some of which are not available in the original Fortran program nor the R package.

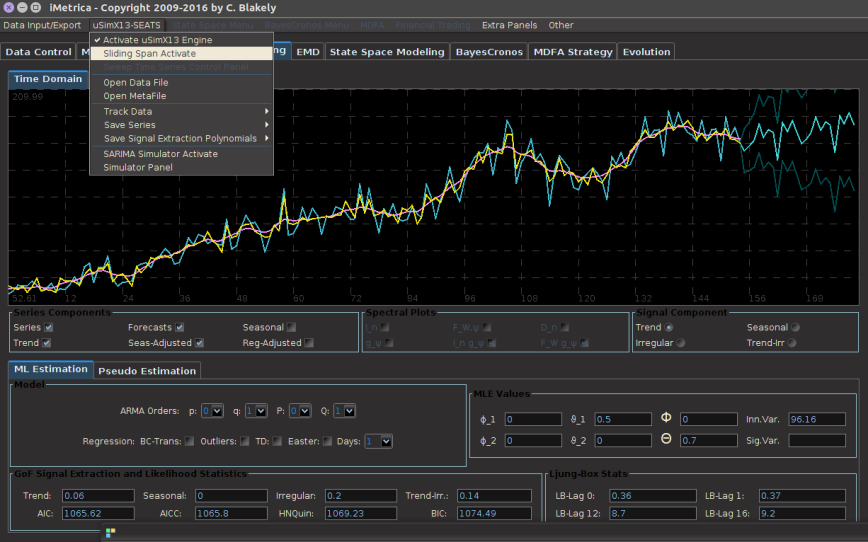
To get started, once iMetrica has been launched, the easiest way to get data into the uSimX13 module is to click on the uSimX13 tab, and then access the menu for the uSimX13 tab at the top in the menu bar, as shown in Figure 1.

Menu_090.png

Figure 1. Opening the uSimX13 menu and selecting Open Data File

For a single data file, click ‘Open Data File’ and a file selection dialog box will appear to choose your data file. I have included a few dozen example real economic time series in the folder called ‘data’ that comes with the iMetrica distribution on my Github. The data files accepted for uSimX13 are very trivial, in that they are simply numerical values given for each time period in each row. If there is a date associated with each time series observation, the date and the observation must be seperated by either a comma or a space. There is also the option of loading in many time series, and this can be achieved by selecting ‘Open Metafile’, and choosing a file that lists all the files to the time series that need to be loaded. It is assumed that all the files are found in the same folder as the Metafile. An example is also given in the ‘data’ directory. Scrolling though the different series that were uploaded can be achieved by accessing the menu, then selecting ‘Simulator Panel’. This will bring up a satellite panel, where on the bottom right you will see a scroll bar with all the loaded time series.

Once the data has been loaded in uSimX13, you will see a plot of the data automatically on the main plotting canvas. The plot should be gray at this point. To turn on the automatic features of the module and begin analyzing, click on ‘Activate uSimX13 engine’ as showm io Figure 1.

Menu_092.png

With the uSimX13 engine activated, this essentially turns on all the automatic estimation components of X-13-AS. The original data will be plotted in cyan, while all the extraction signals will be accessible through clicking on the checkbars in the control panel. One can change the modeling SARIMA dimensions, add outlier or other regression detection components, and visualize automatically the changes in the extracted components. All signal extraction and goodness-of-fit diagnoistcs are shown on the bottom of the control panel.

Once the data has been loaded in, one exploratory feature on the module is the ‘Sliding Span Activate’ that offers a unique approach to model selection and goodness-of-fit by addressing multi-step ahead forecasting error on ‘test’ portions of the data. Such analysis can be readily achieved by using the ‘Sliding Span Activate’ component along with the ‘Sweep Time Series Control Panel’. Further details of this interactive model selection feature can be found in one of my previous articles on model selection here.

That will get you started with the basic features in loading data into the model. To learn more, click on the .pdf file here usimx13 for a full guide on how to use all the components in the uSimX13, including a quick guide on the inference of model selection with signal extraction goodness-of-fit diagnostics that was featured in a recent paper by myself and colleague Tucker McElroy here .

Coming next week: Interactive modeling with State Space and RegComponent models using the State Space Modeling module in iMetrica.


iMetrica for Linux Ubuntu 64 now available

The MDFA real-time signal extraction module

The MDFA real-time signal extraction module

My first open-source release of iMetrica for Linux Ubuntu 64 can now be downloaded at my Github, with a Windows 64 version soon to follow. iMetrica is a fast, interactive, GUI-oriented software suite for predictive modeling, multivariate time series analysis, real-time signal extraction, Bayesian financial econometrics, and much more.

The principal use of iMetrica is to provide an interactive environment for the numerical and visual analysis of (multivariate) time series modeling, real-time filtering, and signal extraction. The interactive features in iMetrica boast a modeling and graphics environment for analysts, practitioners, and students of econometrics, finance, and real-time data analysis where no coding or modeling experience is necessary. All the system needs is data which can be piped into the system in many forms, including .csv, .txt, Google/Yahoo Finance, Quandle, .RData, and more. A module for connecting to MySQL databases is currently being developed. One can also simulate their own data from a one or a combination of several different popular data generating models.

With the design intending to be interactive and self-enclosed, one can change modeling data/parameter inputs and see the effects in both graphical and numerical form automatically. This feature is designed to help understand the underlying mechanics of the modeling or filtering process. One can test many attributes of the modeling or filtering process this way both visually and numerically such as sensitivity, nonlinearity, goodness-of-fit, any overfitting issues, stability, etc.

All the computational libraries were written in GNU C and/or Fortran and have been provided as Native libraries to the Java platform via JNI, where Java provides the user-interface, control, graphics, and several other components in a module format, and where each module specializes in a different data analysis paradigm. The modules available in this open-source version of iMetrica are as follows:

1) Data simulation, modeling and fitting using several popular econometric models

  • (S)ARIMA, (E)GARCH, (Multivariate) Factor models, Stochastic Volatility, High-frequency volatility models, Cycles/Trends, and more
  • Random number generators from several different types of parameterized distributions to create shocks, outliers, regression components, etc.
  • Visualize in real-time all components of the modeling process

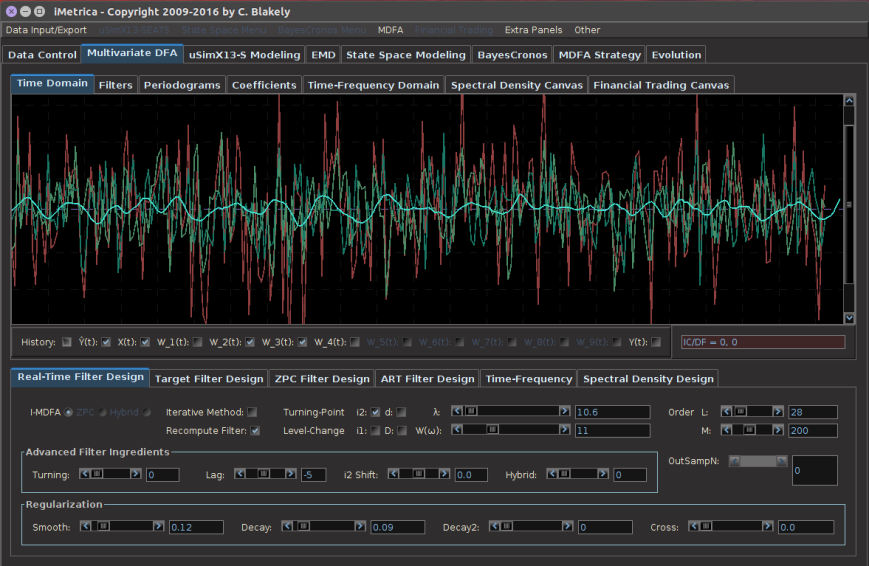
2) An interactive GUI for multivariate real-time signal extraction using the multivariate direct filter approach (MDFA)

  • Construct mulitvariate MA filter designs, classical ARMA ZPA filtering designs, or hybrid filtering designs.
  • Analyze all components of the filtering and signal extraction process, from time-delay and smoothing control, to regularization.
  • Adaptive real-time filtering
  • Construct financial trading signals and forecasts
  • Includes a real-time/frequency analysis module using MDFA

3) An interactive GUI for X-13-ARIMA-SEATS called uSimX13

  • Perform automatic seasonal adjustment on thousands of economic time series
  • Compare SARIMA model choices using several different novel signal extraction diagnostics and tools available only in iMetrica
  • Visualize in real-time several components of modeling process
  • Analyze forecasts and compare with other models
  • All of the most important features of X-13-ARIMA-SEATS included

4) An interactive GUI for RegComponent (State Space and Unobserved Component Models)

  • Construct unobserved signal components and time-varying regression components
  • Obtain forecasts automatically and compare with other forecasting models

5) Empirical Mode Decomposition

  • Applies a fast adaptive EMD algorithm to decompose nonlinear, nonstationary data into a trend and instrinsic modes.
  • Visualize all time-frequency components with automatically generated 2D heat maps.

6) Bayesian Time Series Modeling of ARIMA, (E)GARCH, Multivariate Stochastic Volatility, HEAVY models

  • Compute and visualize posterior distribtions for all modeling parameters
  • Easily compare different model dimensions

7) Financial Trading Strategy Engineering with MDFA

  • Construct financial trading signals in the MDFA module and backtest the strategies on any frequency of data
  • Perform analysis of the strategies using forward-walk schemes
  • Automatically optimize certain components of the signal extraction on in-sample data.
  • Features a toolkit for minimizing probability of backtest overfit

Tutorials on how to use iMetrica can be found on this blog and will be added on a weekly basis, with new tools, features, and modules being added and improved on a consistent basis.

Please send any bug reports, comments, complaints, to clisztian@gmail.com.

Dream within a dream: How science fiction concepts from the movie Inception can be accomplished in real life (via MDFA)

“Careful, we may be in a model…within a model.” (From an Inception movie poster.)

“Careful, we may be in a model…within a model.” (From an Inception movie poster.)

Have you ever seen the movie Inception and wondered, “Gee, wouldn’t it be neat if I could do all that fancy subconscious dream within a dream manipulation stuff”? Well now you can (in a metaphorical way) using MDFA and iMetrica. I explain how in this article.

Before I begin, may I first draw your attention to a brief introduction of the context in which I am speaking, and that is real-time signal extraction in (nonlinear, nonstationary) information flow. The principle goal of filtering and signal extraction in real-time data analysis for whatever purpose necessary (financial trading, risk analysis, real-time trend detection, seasonal adjustment) is to detect and pinpoint as timely as possible a desired sequence of events in an incoming flow of data observations. We emphasize that this detection should be fast, in that the desired signal, or sequence of events, should be so robust in its timeliness and accuracy so as to detect turning points or actions in targeted events as they happen, or even become so awesome that it manages to anticipate what will happen in the future. Of course, this is never an exact science nor even always possible (otherwise we’d all be billionaires right?) and thus we rely on creative ways to cope with the unknown.

We can also think of signal extraction in more abstract terms. Real-time signal extraction entails the construction of a ‘smart’ illusion, an alternative to reality, where reality in this context is a time series, the information flow, the raw data. This ‘smart’ illusion that is being constructed is the signal, the vital information that has been extracted from an abundance of “noise” embedded in the reality. And the signal must produce important underlying secrets to satisfy the needs of the user, the signal extractor. How these signals are extracted from reality is the grand challenge. How are they produced in a robust, fast, and feasible manner so as to be effective in the real-time flow of information? The answer is in MDFA, or in other words as I’ll describe in this article, penetrating the subconscious state of reality to gain access to hidden treasures.

After recently re-watching the Christopher Nolan opus entitled Inception starring Leonardo DiCaprio and what seems like most of the cast from the Dark Knight Trilogy, I began to see some similarities between the main concepts entertainingly presented in the movie (using some pimped-up CGI), and the mathematics of  signal extraction using the multivariate direct filtering approach (MDFA). In this article I present some of these interesting parallels that I’ve managed to weave together.  My ultimate goal with this article is to hopefully paint a vivid picture of some interesting details stemming from the mathematics of the direct filtering approach by using the parallels that I’ve contrived between the two. Afterwards, hopefully you’ll be on your way to entering the realm of ‘dreaming within dreaming’, and extracting pertinent hidden secrets embedded in a flurry of noise.

The film introduces a slick con man by the name of Cobb (played by DiCaprio), and his team of super well-dressed con artists with leather jackets and slicked back hair (the classic con man look right?). The catchy idea that resides in the premise of the film is that these aren’t ordinary con men: they have a unique way of manipulating reality: by entering the dreams (subconscious ) of their targets (or marks as they call them in the film) and manipulate their subconscious dream state under the goal of extracting a desired idea or hidden secret. Like any group of con men, they attempt to construct a false reality by creating a certain architecture and environment in the target’s dream. The effectiveness of this ‘heist’ to capture the desired signals in the dream relies on the quality of the architecture and environment of the dream.

So how does all this relate to the mathematics of the MDFA for signal extraction. My vision can be seen as follows. In manipulating the target’s subconscious , Cobb’s group basically involves a collection of four components. Each one can be associated with a mathematical concept embedded in the MDFA.

The Target – At the highest level, we have reality. The real world in which the characters, and the target (victim), live. The target victim has an abundance of hidden information among the large capacity of mostly noise, from which Cobb’s group wish to manipulate and extract a hidden secret, the signal. In the MDFA world, we can associate or represent the information flow, the time series on which we perform the signal extraction process as the target victim in the real world. This is the data that we see, the reality. This data of course is non-deterministic,  namely we have no idea what the target victim has in mind for the future. The process of extracting the hidden thoughts or ideas from this target victim is akin to, in the MDFA world, the signal extraction process. The tools used to do the extracting are as follows.

The Extractor – The extractor is depicted in Inception as a master con man, a person who knows how to manipulate a subject (the target) in their subconscious dreaming world into revealing their deepest mental secrets. As the extractor’s goal is manipulation of the subconscious of a target to reveal a certain signal buried within reality, the extractor must transform the real-world conscious mental state of the target from reality into the dreaming subconscious world, by inducing a dream state. The multivariate direct filtering process of transforming the data (reality) into spectral frequency space (the subconscious ) via the Fourier transform to reveal the signal given the desired target data is metaphorically very similar to this process. The Inception extractor can be seen as being parallel to the process of transforming the data from reality into a subconscious world, the spectral frequency domain. It’s in this dreaming subconscious world, the frequency domain, where the real manipulation begins, using an architect.

The Architect – The Inception architect is the designer of the dream who constructs and builds the subconscious world into which the extractor brings the subject, or target. Just as the architect manipulates real world architecture and physics in order to create paradoxes like an endless staircase, folding buildings, smooth transitions from one place to another and other various phenomena otherwise impossible in the real world, the architect in the filtering world is the toolkit of filtering parameters that render the finite-dimensional metric space in which one constructs the filter coefficients to produce the desired signal. This includes the extraction rules (namely the symmetric target filter), customization for timeliness and speed, and regularization to warp and bend the finite dimensional filter metric space. Just as many different paths in the subconscious world toward the manipulation of the target subject exist and it is the architect’s job to create the optimal environment for extracting the desired signal, the architect in the direct filtering world uses the wide ranging set of filter parameters to bend and manipulate the metric space from which the filter coefficients are built and then used in the signal extraction process. Just as changing dynamics in the Inception real world (like the state of free-falling) will change the physics of the dreamt subconscious world (like floating in hotel elevator shafts while engaging in physical combat, Matrix style),  changing dynamics in the information flow will alter the geometry of the consequent architecture being built for the filter. And furthermore, just as the dream architect must be highly skilled in order to manipulate correctly, the MDFA architect must be highly skilled in order to construct the appropriate space in which the optimal signal is extracted (hint hint, call me or Marc, we’re the extractors and architects).

Dream within a dream – As one of the more fascinating concepts introduced in Inception, the concept of the dream within a dream was also the main trick to their success in dream manipulation. Starting from reality, each level of the dreaming subconscious state can be further transposed into another level of subconscious , namely dreaming within a dream. The dream within a dream process puts you into a deeper state of dreaming. The deeper you go, the further one’s mind is removed from reality. This is where the subject of dynamic adaptive filtering comes into play (see my previous article here for an intro and basics to dynamic adaptive filtering in iMetrica). In the direct filtering world, dynamic adaptive filtering is akin to the dream within a dream concept: Once in a level of subconscious (the spectral frequency space in MDFA), and the architect has created the dream used for manipulation (the metric space for the filter coefficients), a new level of subconscious can then be entered by introducing a newly adapted metric space based on the information extracted from the first level of subconscious.

In the dream within a dream, time is the other factor. The deeper you go into a dream state, the faster your mind is able to imagine and perceive things within that dream state. For example, one minute in reality can seem like one hour in the dream state. At the next level of subconscious, at each level in the subconscious , the element of time speeds up exponentially. A similar analogy can be extracted (no pun intended) in the concept of dynamic adaptive filtering. In dynamic adaptive filtering, we first begin by extracting a signal with the desired filter architecture at the first level transformation from reality to the spectral frequency space. When new information is received and our extracted signal is not behaving how we desire, we can build a new filter architecture for manipulating the signal with the newly provided information, with all the filter parameters available to control the desired filter properties. We are inherently building a new updated filter architecture on top of the old filter architecture, and consequently building a new signal from the output of the old signal by correcting (manipulating) this old signal toward our desired goals. This is akin to the dream within a dream concept. And just like the idea of time passing much faster at each subconscious level, the effects of filter parameters for controlling regularization and speed occur at a much faster rate since we are dealing with less information, a much shorter time frame (namely the newly arrived information) at each subsequent filtering level. One can even continue down the levels of subconscious, building a new architecture on top of the previous architecture, continuously using the newly provided information at each level to build the next level of subconsciousness; dream within a dream within a dream.

To summarize these analogies, I’ll be adding a graphic soon to this article that explains in a more succinct manner these parallels described above between Inception and MDFA. In the meantime, here are the temporary replacements.

Haters gonna hate... extractors gonna extract.

Haters gonna hate… extractors gonna extract.

Nolan, why you leavin' Leo out?

Nolan, why you leavin’ Leo out?